Evaluating Runway Conditions
There are many factors affecting on Runway conditions. Moventor is specialized on evaluating safe landing and take-off conditions on runway. Some of the criteria are based on weather but many are also depending on the actual condition of the pavement. Pavement micro and macro texture are important factors as well as evaluating bumps on the runway with Boeing Bump Index. And of course weather and number of landings will cause the friction level going lower on landing areas which is a safety issue. Moventor offers variety of products evaluating these criteria which helps airport operators ensure safe runway conditions in all times.
Global Runway Reporter

Boeing Bump Index
This guideline gives airport operators procedures to evaluate a pavement surface profile in terms of roughness and the impact pavement roughness may have on civilian airplanes. There are many factors affecting the roughness of the surface of runway. One important factor among others is Boeing Bump Index.

INTRODUCTION TO AIRPORT PAVEMENT ROUGHNESS
Important factors in evaluating pavement roughness
Pavement Surface Irregularities
Airport pavement surfaces must be free of irregularities that can impair safe operations, cause damage, or increase structural fatigue to an airplane. Engineers refer to these surface irregularities as pavement roughness or lack of smoothness.
Airfield versus Highway Roughness
The highway industry defines pavement smoothness/roughness in terms of the ride quality experienced by a passenger. Automotive manufacturers design suspension systems to reduce the impact of common surface irregularities and improve overall ride quality. In contrast, the primary purpose of an airplane suspension system is to absorb energy expended during landing. Airplane suspension systems have less capacity to dampen the impact of surface irregularities due to the magnitude of the energy that must be addressed during landing. Airfield pavement roughness is defined in terms of fatigue on aircraft components (increase stresse and wear) and/ or other factors which may impair the safe operation of the aircraft (cockpit vibrations, excessive g-forces, etc.).
Passenger Comfort
Airport pavement roughness is not defined by perceived ride quality or passenger discomfort. Although important, passenger discomfort due to pavement surface irregularities is often not a significant issue since the degree of discomfort is small and the time of exposure is limited to a few seconds. Further, passenger discomfort often occurs during takeoff and landing operations when engine noise, aerodynamic noise, and/or horizontal acceleration or deceleration otherwise distract the passengers.
Factor Affecting Safe Airplane Operations
Stress on airplane components, reduced braking action, and the ability to view cockpit instrumentation can impact the safe operation of an airplane. Pavement surface irregularities may cause enough vibrations in the cockpit that pilots cannot focus on critical instrumentation or have difficulty manipulating the controls during takeoff or landing. Pavement surface irregularities can also cause increased stress on critical airplane components, which increases the risk of premature failure. Airplane response to surface irregularities can reduce braking capacity as the airplane responds to vertical acceleration. These factors can occur individually or in combination, depending on airplane response.
Pilot Response and Feedback
Pilot observations and complaints are an important factor in determining pavement roughness. Although pilot observations do not directly indicate that structural fatigue of airplane components is occurring, they are often the first sign that something is wrong with the pavement profile. The procedures in this AC use pilot observations to establish basic criteria for evaluation of pavement roughness.
Surface Texture
Pavement roughness is not the same as pavement texture. Pavement texture is the micro texture of the immediate pavement surface which contributes to friction between the airplane wheel and the pavement surface. Pavement texture and pavement grooving is not a source of roughness. See ASTM E 867-04, Terminology Relating to Vehicle-Pavement Systems, for definitions of texture.
Construction Standards
When constructed in accordance with the design standards of AC 150/5300-13, Airport Design, and the construction standards of AC 150/5370-10, Standards for Specifying Construction of Airports an airfield pavement should not have issues with surface irregularities. However, as a pavement ages, the surface profile may vary from the original design standards due to factors such as frost heave or subgrade settlement.
Categories of Airfield Pavement Roughness
The FAA groups airfield pavement roughness into two categories based on the dimensions and frequency of surface deviations:
1) Single Event Bump.
Single event bumps are isolated events where changes in pavement elevation occur over a relatively short distance of 100 meters (328 feet) or less. Such elevation changes may occur as an abrupt vertical lip or as a more gradual deviation from a planned pavement profile. Depending on the operational speed and bump length, an airplane suspension system may not be able to fully absorb the energy produced when it encounters a bump. Airplane components and occupants feel the impact as a shock or sudden jolt.
2) Profile Roughness.
The FAA defines profile roughness as surface profile deviations present over a portion of the runway that cause airplanes to respond in ways that can increase fatigue on airplane components, reduce braking action, impair cockpit operations, and/or cause discomfort to passengers. Response depends on airplane size, weight, and operation speed. Even when roughness does not cause discomfort to passengers, it may still affect the fatigue life of airplane components or decrease operational safety of the airplane. Depending upon airplane characteristics and operating speed, an airplane may be excited into harmonic resonance due to profile roughness which can increase inertial forces or vibrations within the airplane structure.
Evaluating Boeing Bump Index
Undesirable elevation changes on runway pavements can increase stress on airplane components, reduce braking action, make it difficult for pilots to read cockpit instrumentation, and/or cause discomfort to passengers. Typically, large wavelength bumps are the most prevalent but are not usually visible to the naked eye. The most critical bump height associated with these large wavelength bumps depends on the relationship between the wavelength and the natural frequency of the aircraft. Single step type bumps—or a vertical deviation with zero length, i.e. a vertical lip or fault in the pavement surface— rarely cause problems in service because the step size is usually within the acceptable range.
Identification and guidelines
There are many factors to consider when evaluating Boeing Bump Index. Usually the index is analyzed from the length of the runway and indentified the length and height of the bumps. The bump height can be negative or positive from the imaginary average height of the runway. Bumps under 120m are calculated with the analysis. Longer bumps than that doesn´t have an effect on airplanes that much. The measures should be done according to landing gear areas. The airplanes are different and therefore they are grouped on different classifications. Measures should be done according to the group of airplanes landing to the airport. This apply also to friction measuring, which is usually done on both sides of the centerline at certain distance.
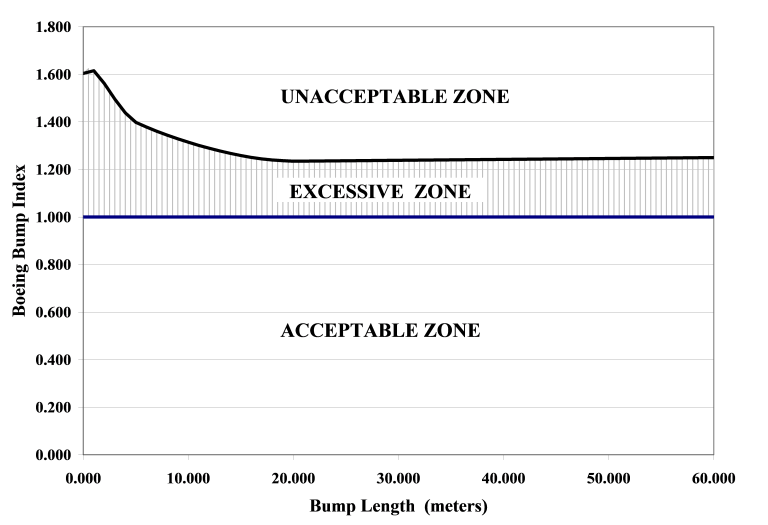
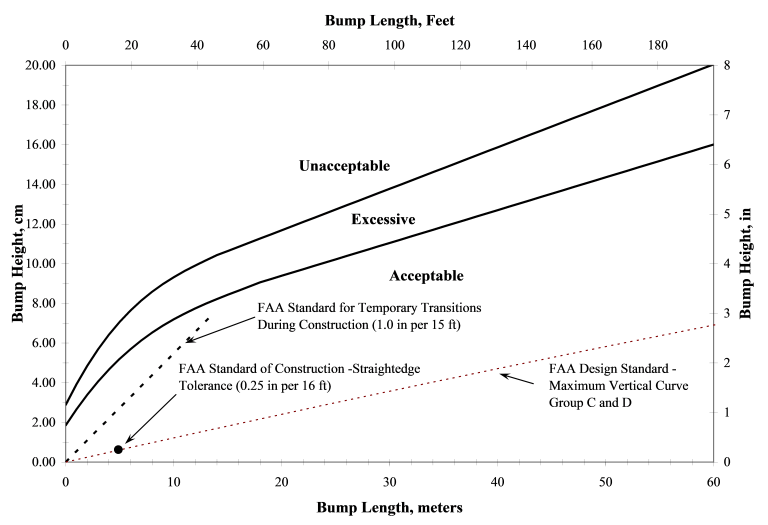
When the Boeing Bump Index and graphs has been measured, results needs to be analyzed. The bumps can be categorized to acceptable, excessive and unacceptable groups. Good BBI (Boeing Bump Index) measuring devices does this categorization automatically. Below we can see the bump length evaluation of runway bumps.
Procedures after evaluating Boeing Bump Index
The image below recreates the acceptable, excessive, and unacceptable evaluation zones of previous image in terms of BBI. When the BBI value is below 1.0, the Boeing bump criteria is in the acceptable zone. Values of BBI greater than 1.0 fall in either the excessive or unacceptable zones.
The software will tell which bumps are in which category and where are the bumps are located. If the results are in:
Acceptable: Operations in this range are acceptable for all airplanes. As a pavement ages, various factors such as frost heave or isolated pavement failures may lead to bump height and length combinations that approach the limit of the acceptable range.
Experience indicates that pilots begin reporting excessive roughness as conditions move closer to the excessive range. When pilot reports begin to occur, airport operators should start identifying the bump locations and preparing for corrective actions. These preparations should include scheduled maintenance activity to monitor the pavement profile.
Whenever roughness is above the acceptable zone, airplane gear fatigue becomes more critical than passenger discomfort or cockpit acceleration limitations.
Excessive: The FAA encourages airport operators to repair pavements as roughness levels enter the excessive zone. Airplane response to excessive levels of roughness becomes noticeably intolerable to both airplane crews and passengers. Roughness of this magnitude will create acute discomfort for all occupants in the airplane. Instrument interference in the cockpit may be severe. This roughness level may also result in a short-term inability to steer the airplane as well as excessive reduction in nose and main gear fatigue life. Immediate pavement repairs are necessary at this level but closure of the affected pavement is not required.
Unacceptable: Roughness levels in the unacceptable zone warrant immediate closure of the affected pavement. Repairs are necessary to restore the pavement to an acceptable level.
Equipment for measuring Boeing Bump Index
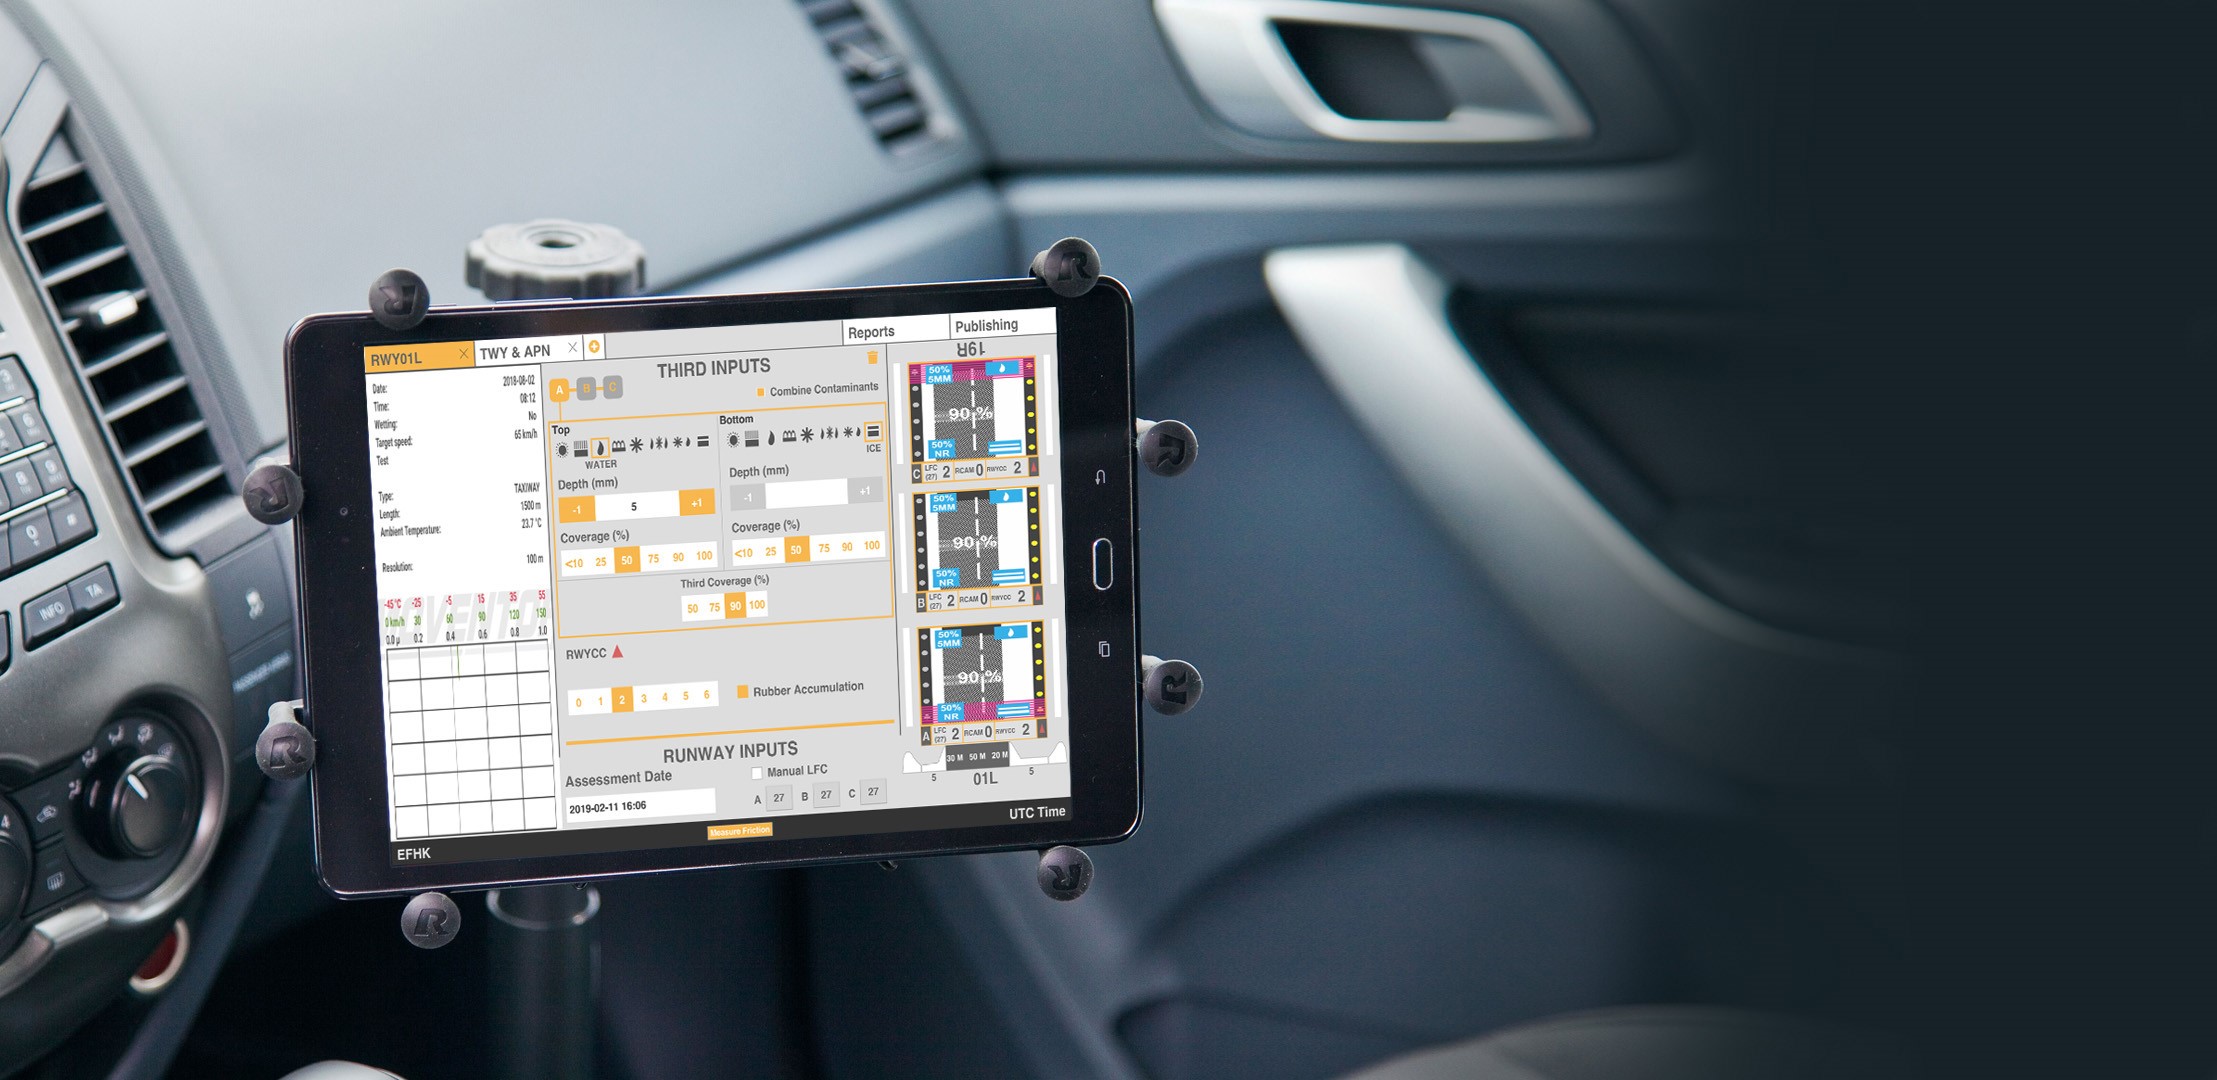
Moventor offers equipment for evaluating runway roughness as well as Boeing Bump Index. The equipment is small and simple and is either installed to Skiddometer BV11 friction tester or individually on any car. The software runs on Tablet computer and results can be stored on memory or sent to web service. The systems can work individually or integrated to Skiddometer BV11 friction testers when all information can be measured on same runs making friction tester more multi purpose units.
Laser Profilometer
The device is used to measure the road or runway pavement profile and the macro / mega texture. It consists of a beam with a desired length and a laser instrument installed in a car or integrated Skiddometer BV11 friction tester. As a result the surface profile is measured and shown on the display of a Laptop or Tablet computer. The results are also stored in the memory and can be sent to Web Service. The beam is also provided with an inclinometer.
The equipment can be integrated with Moventors friction products or can work individually. The laser accuracy is selected by the needs of the users and integrations in many ways are possible. It can be equipped also with IRI (International Roughness Index) measuring device.
Read more
Range of use
Laser profilometer can be used for several purposes:
- Research of the wear resistance of surfaces
- The wearing process of road, street and airport pavements
- Traffic noise research
Measuring principle
The laser unit is automatically driven by 12V electrics. The profile is measured with a laser instrument at desired intervals, e.g. 1 or 2mm. The measuring process is controlled from the computer by giving operation orders such as the starting and end points, measuring interval, the name of the measurement, the date, start order etc. When started the device makes a measurement and returns back to the starting point.
The power is taken from a separate 12V car battery or directly from the vehicle.
Technical information
| Beam length | Usually 1.5 or 4m |
| Measuring interval | 1mm (macro texture) |
| Resolution of laser | 0.05mm (micro / macro texture) |
| Measuring time | 1min / 20s |
Definitions
| Texture class | Wave length | Note |
|---|---|---|
| Micro texture | 0-0.5mm | Practical range 0.05-0.5mm |
| Macro texture | 0.5-50mm | |
| Mega texture | 50-500mm | |
| Roughness IRI | 0.5-30m | Measuring range 0.5-8m with 4m beam length |
| IRI4 | 0.5-4m |


